

Compute Notes · Research · 20 October 2026
This article is personal research and opinion only and does not constitute investment advice.
Key Takeaways
AI spending now runs through chips, power, construction and finance. An investor can hold several sectors and still be exposed to the same customer’s capital budget.
Two opportunities grow together over the next five years: delivering dependable compute, and embedding it in work customers will pay to complete. They need different capital and will have different winners.
The evidence of return is thin. 69% of the S&P 500 point to a live AI deployment, but only about 2% disclose a metric tracked over time.
Agents earn the right to charge through retained paid usage and an acceptable cost per successful task, not through activity.
The cycle can succeed while an investment fails. The core risk is timing: suppliers collect revenue before customers prove what the new capacity earns.
What would change my view: retained usage and measured customer value failing to grow faster than delivery and replacement costs.
A datacenter order becomes a semiconductor sale, an electrical-equipment backlog, a construction project and eventually a financing obligation. On the other side of that chain, a business still has to find something useful to do with the intelligence it buys.
Building on a16z’s “everything cycle” framing,[4] my argument is that AI connects technology spending to a much wider range of industries. It also connects their risks. An investor can own several different sectors and still be exposed to the same customer’s capital budget.
My five-year thesis is that two opportunities will develop together: delivering dependable compute and embedding it in work people will pay to complete. Their growth rates, capital needs and winners may look very different.
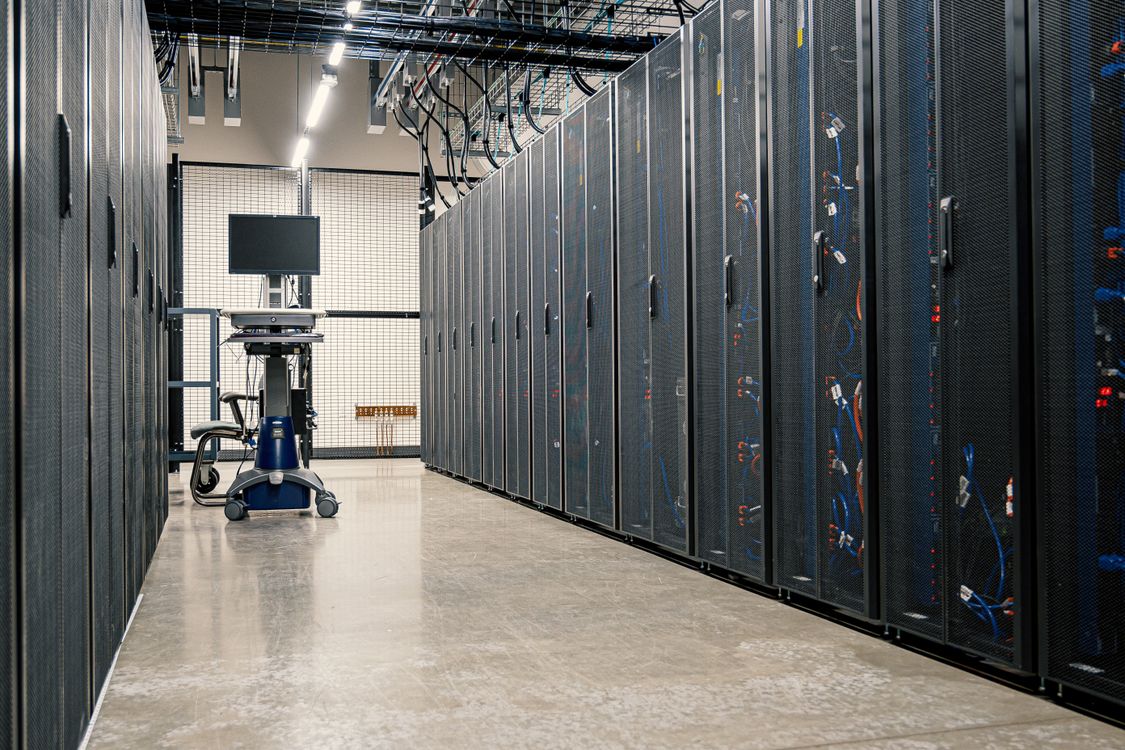
Datacenter racks and cabling. Illustrative photograph taken in 2020; not a photograph of a current AI buildout. Photo: Brett Sayles / Pexels. Pexels License.
The buildout has a railway-sized ambition
The historical comparison needs a tense correction. A September Brookings conference paper models AI infrastructure investment averaging 3.63% of US GDP over 2025–2032, against 2.24% for railroad construction over 1870–1890. The AI figure is a scenario. It does not establish that realized spending has already passed the railroad boom. Asset coverage and economic lives also differ.[1]

Annual average US investment / GDP. Gold indicates a scenario, not realized expenditure. Historical asset coverage differs. Source: Van Nieuwerburgh, September 2026, Table 1. [1]
Power provides another view of the scale. The IEA’s updated 2026 outlook estimates global datacenter electricity consumption at 485 TWh in 2025, rising to 950 TWh in 2030. That includes conventional computing as well as AI.[2]
The analogy to a factory is useful here. Tesla’s filed video transcript uses the phrase “the factory is the product.”[12] Applied to compute, the product includes the entire operating system around the chips: usable power, cooling, networking, scheduling and maintenance. A GPU without dependable electricity is an expensive promise.
For infrastructure founders, that creates openings in commissioning, utilization and delivery reliability. For investors, a large order book deserves a second question: when does it turn into cash, and who carries the cost of delay?
Enterprise diffusion needs a better scoreboard
In Apollo’s Q2 S&P 500 disclosure series, sourced from The AI Value Gap, 69% met the live-deployment threshold, 29% quantified a result, and 2% disclosed a metric tracked over time.[3] a16z’s September deck reports the same 69% and 2% for the S&P 500 independently.[4] These are nested thresholds rather than an additive breakdown: the quantifiers sit inside the deployers, and the trackers inside the quantifiers.

Apollo’s S&P 500 disclosure series, Q2 2026. Nested disclosure thresholds, not an additive breakdown. The underlying index spans the S&P 500 and the FTSE 100 and excludes AI-value-chain firms; Apollo’s S&P-only denominator is not published. Source: Apollo / The AI Value Gap, 11 September 2026. [3]
That is a disclosure gap, not a finding that the remaining companies receive no benefit. It does tell us how little consistent evidence investors have for the return on adoption.
The spending gap reinforces the need for precision. Ramp measures AI spending per employee, and on that basis the distribution is steeply skewed. In July 2026 the median company in its panel spent $11.95 per employee per month. The top 10% spent $650. The top 1% spent a median first published as $7,400 and later revised up to $7,976 as further transactions landed.[5] This is one vendor’s customer panel, not a census of businesses.
That top cohort is also small enough to move sharply. Ramp’s September update reports its median monthly spending per employee fell to $7,205 in August, a decline of about 9.7%, which Ramp attributes to volatility in a small group and to summer seasonality.[5] Concentrated spending shows intensity. It does not prove that the typical company will eventually spend the same amount.
The founder opportunity sits inside that distinction. Connecting a model to company data is a beginning. Completing an approved workflow, handling exceptions and documenting the financial outcome is a business.
Consider month-end close. A useful product might gather evidence, reconcile balances and prepare a review package. The buyer should measure review hours, exception rates and days to close against the existing process. Human oversight belongs in the cost calculation. A faster first draft alone can leave the total workload unchanged.
Agents must earn the right to charge
An agent becomes economically interesting when a user delegates a recurring task, the system completes it reliably, and the result justifies paying again. Downloads, chatbot accounts and autonomous work are different measures.
ITU estimates that six billion people used the internet in 2025.[6] That is an enormous distribution opportunity. It is not a count of prospective paying agent users. I could not verify a consistent global measure supporting “only a few million agent users today,” so this analysis does not use that number.
Advertising monetization needs a defined product, period and user denominator before it can anchor a market model. Advertising revenue per active user is a different economic relationship from a consumer paying an agent subscription. Neither establishes agent willingness to pay.
A transparent scenario is more useful. At an assumed 100 million paying users, annual net revenue per payer of $200, $600 or $1,200 produces $20 billion, $60 billion or $120 billion in annual net revenue, before delivery costs. These are arithmetic cases, not adoption forecasts.

Annual net revenue before delivery costs, US$bn. Compute Notes arithmetic scenarios with assumed paying users and net annual revenue per payer. These are not forecasts.
Even the lowest case says little about profit without delivery costs. At $200 of annual net revenue, assumed direct costs of $60, $120 or $180 leave gross margins of 70%, 40% or 10%, before research, sales and overhead. Retries, human intervention and support can consume the surplus a product appears to create.
The attractive product will demonstrate retained paid usage and an acceptable cost per successful task. More activity helps only when its economics hold.
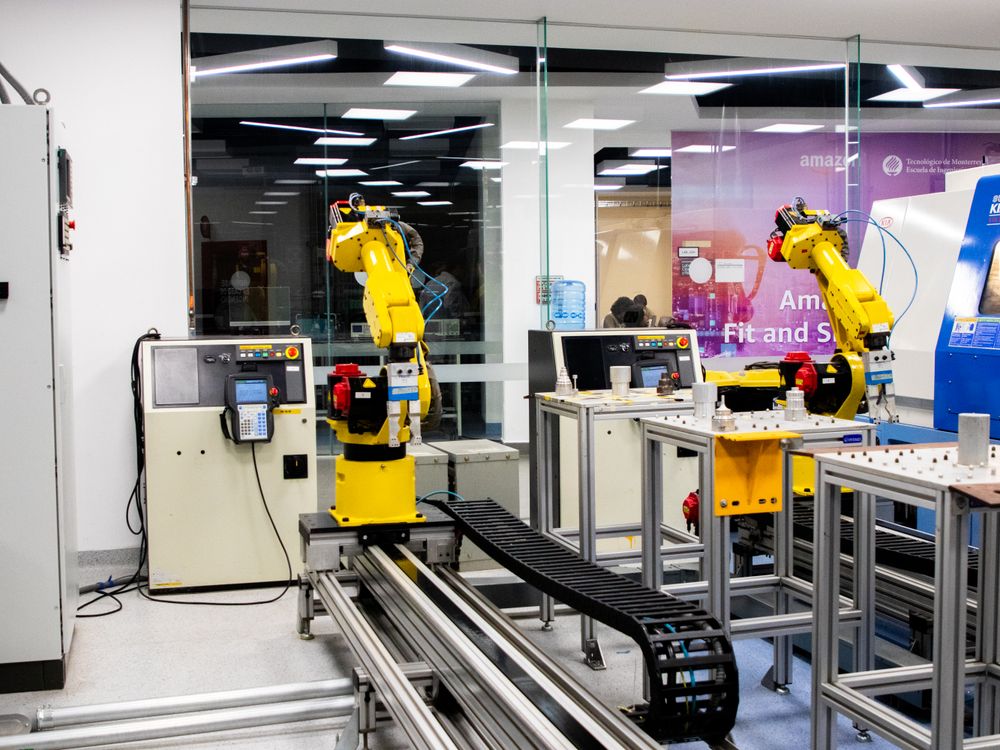
Industrial robot arms. Illustrative photograph; not evidence of general-purpose autonomy. Photo: Ludovic Delot / Pexels. Pexels License.
Seven themes, seven routes to a paying customer
The opportunity set extends well beyond office software. Selected observations span different stages: IFR reports five million industrial robots operating in 2025, while Waymo began fully autonomous public trips in Las Vegas in September 2026, initially for riders invited from an interest list.[8][9] Neither observation proves that general-purpose robots or nationwide autonomy will scale profitably.
In biology, DeepMind’s September AlphaGenome Atlas release offers predicted molecular effects for all nine billion possible single-letter changes in the human genome.[10] It is a research resource. The FDA’s AI-enabled device list demonstrates a separate path toward authorized clinical uses, with requirements specific to each device.[11]
The cited observations support enterprise disclosure [3], industrial robotics [8], initial autonomy service [9], bio research [10] and device-specific health authorization [11]. They do not prove the investment cases. Consumer-agent monetization and American Dynamism are hypothesis-only themes in this piece. My priorities are commercial questions:
Theme | A plausible founder entry point | Evidence investors should require |
|---|---|---|
Consumer agents | One frequent task with permission to act | Paid retention and cost per successful task |
Enterprise diffusion | A narrow workflow tied to an existing budget | Measured savings after review and integration costs |
Robotics | A repeatable task in a controlled setting | Uptime, intervention rate and customer payback |
Autonomy | A viable operating area or fleet use case | Safety evidence and contribution per paid mile |
AI × bio | Research tooling linked to experimental validation | Reproducibility, milestones and partner payments |
Personal health | A defined care or administrative workflow | Appropriate validation, adoption and a clear payer |
American Dynamism | A specific manufacturing, energy or public-sector need | A funded buyer, delivery acceptance and repeat orders |
These are investment hypotheses for 2026–2031, not seven synchronized growth forecasts. Software can iterate quickly. Factories, clinical validation and procurement can require much longer commitments.
The cycle can succeed while an investment fails
The central risk is timing: suppliers collect revenue before end customers have proven what the new capacity earns. Financing can extend that gap, but it does not remove it.
Meta illustrates the cash demands. In Q2 2026 it reported $31.08 billion of capital expenditure and $784 million of free cash flow. These are company-wide figures, and the spending is not exclusively AI.[7] Strong demand for suppliers can coexist with pressure on the buyer’s cash generation.
My investor preference is for evidence of value capture: delivery against contracted demand, customer concentration that can survive a setback, and returns after replacement capital. A useful technology can still be purchased at a price that leaves little room for error.
For founders, I would start with a paid workflow pilot and an agreed baseline. Expansion should follow measured customer value and contribution margin. For Compute Notes’ infrastructure sourcing, the corresponding proof is an energization date, a qualified customer and contract terms that allocate delays clearly.
Over the next several quarters, I would watch whether tracked enterprise outcomes broaden, spending intensity persists beyond a small cohort, and agent revenue grows faster than delivery costs. The five-year opportunity is substantial. The strongest companies will make their progress measurable.
Carol Chen
Founder, Compute Notes
Builder of AI-native businesses and investor in AI infrastructure
LinkedIn: linkedin.com/in/carol-c-76461498
Website: computenotes.co
Network: network.computenotes.co
Sources and claim notes
Evidence reviewed through 4 October 2026; all sources re-verified 7 October 2026. Source statements, observations and author scenarios remain distinct.
1. Brookings / Stijn Van Nieuwerburgh, Financing the AI Buildout — Web publication 23 September 2026; manuscript draft 4 September; conference 24–25 September. Conference draft, Table 1 p.5 and Appendix C pp.23–24. Annual average investment/GDP. AI is a modeled 2025–2032 scenario, historical categories differ in scope.
2. IEA, Key Questions on Energy and AI — 16 April 2026; accessed 4 October 2026. 485 TWh global data-centre electricity in 2025, 950 TWh projected in 2030. Includes non-AI data centres. Forecast, not observed 2030 usage.
3. Apollo / The AI Value Gap, From Who Is Deploying AI to Who Can Prove the ROI — 11 September 2026. Apollo reports Q2 2026 S&P 500 disclosure-series thresholds: 69% live deployment, 29% quantified result, 2% tracked metric, sourced to The AI Value Gap. The nesting is established by that index’s own "proof ladder" methodology rather than by Apollo. The underlying index covers 532 companies spanning the S&P 500 and the FTSE 100, and explicitly excludes the AI value chain — chipmakers and sellers of AI models, platforms and software, along with hybrids such as Apple and Amazon. Apollo’s S&P-500-only denominator is not published. The index is independently maintained by a single author, Amin Mrini. These are disclosures, not an ROI audit; do not equate them with an audited census of all constituents.
4. a16z, State of Markets II — 30 September 2026. Source of the "everything cycle" framing: "Tech is everywhere and in everything. Tech is the everything cycle, now." The same deck independently reports that 69% of the S&P 500 point to a live AI deployment and only about 2% disclose a metric tracked over time, matching the Apollo figures at [3].
5. Ramp, Cracks in the AI Thesis Part 2 — 9 September 2026, together with the preceding August 2026 Ramp AI Index. July 2026 spending per employee per month: median $11.95, top 10% $650, top 1% $7,400 as first published. The September index revised July’s top 1% up to $7,976 after additional July transactions entered the dataset, and reports August at $7,205, approximately -9.7%. The $7,400 print is therefore superseded and is noted here only as the original figure. Ramp states the top-1% cohort is small and more volatile than its median and top-10% estimates, and notes summer seasonality. Ramp’s customer sample is not all businesses. Effective token-price index $1.15 2026 peak in March to $0.68 at the report date, approximately -41%.
6. ITU, Facts and Figures 2025 — 17 November 2025. Estimated global internet users: 6 billion in 2025. Connectivity is an addressable population reference, not an agent user or paying customer count.
7. Meta, Q2 2026 results — 29 July 2026. Q2 capex including finance-lease principal $31.08bn; operating cash flow $31.86bn; reported free cash flow $0.784bn — Meta’s own labelled non-GAAP figure in the release, not a number derived here. It reconciles in US$bn as 31.862 operating cash flow − 30.116 equipment purchases − 0.962 finance-lease principal = 0.784. Meta does not break out AI-specific capital expenditure in either the release or the 10-Q, so the capex figure is company-wide and not exclusively AI. No causal attribution of every cash-flow change to AI.
8. IFR, World Robotics 2026 release — 24 September 2026. 2025 operational industrial robot stock 5 million, up 9%. Industrial robots are not equivalent to humanoids or general-purpose AI robots.
9. Waymo, first public riders in Las Vegas — 14 September 2026. Company announcement of fully autonomous public trips across a service area Waymo describes as nearly 24 miles. Access at launch was gated: riders were invited on a rolling basis from an interest list Waymo reports at over 100,000 people, so this was not open availability. Does not establish nationwide availability or profitability.
10. Google DeepMind, AlphaGenome Atlas — 8 September 2026. Research platform with predicted molecular effects for 9 billion single-nucleotide variants. Prediction resource, not proof of approved therapies or commercial returns.
11. FDA, AI-enabled medical device list — Accessed 4 October 2026. The FDA states the list "is intended to identify AI-enabled medical devices that are authorized for marketing in the United States" and that it "is not a comprehensive resource." As a matter of how device authorization works, clearance is specific to a given device and its intended use; that characterisation is mine, not a quotation from the page. Not a blanket approval of consumer health agents.
12. Tesla, filed video transcript — 20 May 2024 video, 2024 filing. Transcript of Video in DEFA14A accession 0001104659-24-063445 includes “the factory is the product.” The supplied IR PDF also places it on physical PDF page 6; HTML has no corresponding page locator. No named speaker attribution is asserted.
Definitions and limits: the Brookings comparison uses historical annual averages against a modeled AI scenario, with different asset coverage; its primary Table 1 was retrieved for this review. IEA totals include non-AI computing. Apollo reports disclosure thresholds drawn from an index spanning the S&P 500 and the FTSE 100 that excludes AI-value-chain firms, and its S&P-only denominator is unpublished. Ramp measures spending per employee in its own customer sample, and its July top-1% figure was revised after first publication. Agent payer counts and prices are assumed; net revenue is before direct delivery cost, and margin examples use the $200 tier only. Commercial entry points and future returns are author hypotheses, not source forecasts.
Important information
Compute Notes is published by Compute Notes Pty Ltd. This newsletter provides research and commentary for informational purposes only. It is not intended to provide investment, legal, tax or other professional advice and does not take account of your objectives, financial situation or needs.
Information is drawn from sources we believe to be reliable, but its accuracy, completeness and continuing relevance are not guaranteed. Opinions, estimates and forecasts reflect the publication date, may change, and may not eventuate. References to companies, products or securities do not, by themselves, constitute endorsements or recommendations.
Consider your circumstances and seek appropriately qualified advice before making investment or business decisions.
#AIInfrastructure #FinOps #EnterpriseAI #AIEconomics #Compute #PhysicalAI #Token